Observability: Tracing in AWS Lambdas using AWS X-Ray
We have our backend deployed on AWS Lambdas using python runtime and we wanted to trace, debug, and optimize Lambda applications. CloudWatch logs are already there but for performance optimization, debugging, and tracing end-to-end view of requests we opted AWS X-Ray.
AWS X-Ray as described by AWS:
AWS X-Ray helps developers analyze and debug production, distributed applications, such as those built using a microservices architecture. With X-Ray, you can understand how your application and its underlying services are performing to identify and troubleshoot the root cause of performance issues and errors. X-Ray provides an end-to-end view of requests as they travel through your application, and shows a map of your application’s underlying components. You can use X-Ray to analyze both applications in development and in production, from simple three-tier applications to complex microservices applications consisting of thousands of services.
I am trying to document that how we enabled this in our infrastructure:
A. Create a Lambda Layer for aws-xray-sdk python package
Create a directory named python, cd into that directory and do a pip install —-target=./ aws-xray-sdk
You should have contents in this directory something like this:
1
2
3
4
5
6
7
8
9
10
11
12
13
14
15
16
17
18
19
20
21
22
23
❯ ll python
total 72
drwxr-xr-x   3 user  user    96B Nov 17 14:04 __pycache__
drwxr-xr-x   8 user  user   256B Nov 17 14:04 aws_xray_sdk
drwxr-xr-x  10 user  user   320B Nov 17 14:04 aws_xray_sdk-2.8.0.dist-info
drwxr-xr-x   6 user  user   192B Nov 17 14:04 bin
drwxr-xr-x  44 user  user   1.4K Nov 17 14:04 botocore
drwxr-xr-x   9 user  user   288B Nov 17 14:04 botocore-1.23.7.dist-info
drwxr-xr-x  14 user  user   448B Nov 17 14:04 dateutil
drwxr-xr-x  11 user  user   352B Nov 17 14:04 future
drwxr-xr-x   8 user  user   256B Nov 17 14:04 future-0.18.2-py3.9.egg-info
drwxr-xr-x  11 user  user   352B Nov 17 14:04 jmespath
drwxr-xr-x  10 user  user   320B Nov 17 14:04 jmespath-0.10.0.dist-info
drwxr-xr-x   7 user  user   224B Nov 17 14:04 libfuturize
drwxr-xr-x   6 user  user   192B Nov 17 14:04 libpasteurize
drwxr-xr-x   8 user  user   256B Nov 17 14:04 past
drwxr-xr-x   9 user  user   288B Nov 17 14:04 python_dateutil-2.8.2.dist-info
drwxr-xr-x   8 user  user   256B Nov 17 14:04 six-1.16.0.dist-info
-rw-r--r--   1 user  user    34K Nov 17 14:04 six.py
drwxr-xr-x  17 user  user   544B Nov 17 14:04 urllib3
drwxr-xr-x   8 user  user   256B Nov 17 14:04 urllib3-1.26.7.dist-info
drwxr-xr-x   8 user  user   256B Nov 17 14:04 wrapt
drwxr-xr-x   8 user  user   256B Nov 17 14:04 wrapt-1.13.3-py3.9.egg-info
compress this python directory into zip so that all the above-shown contents are under the python directory in the archive. Upload the zip into a layer in the lambda console. The detailed process is documented here. Attach the layer to your lambda.
B. Enable X-Ray in the Lambda Configuration
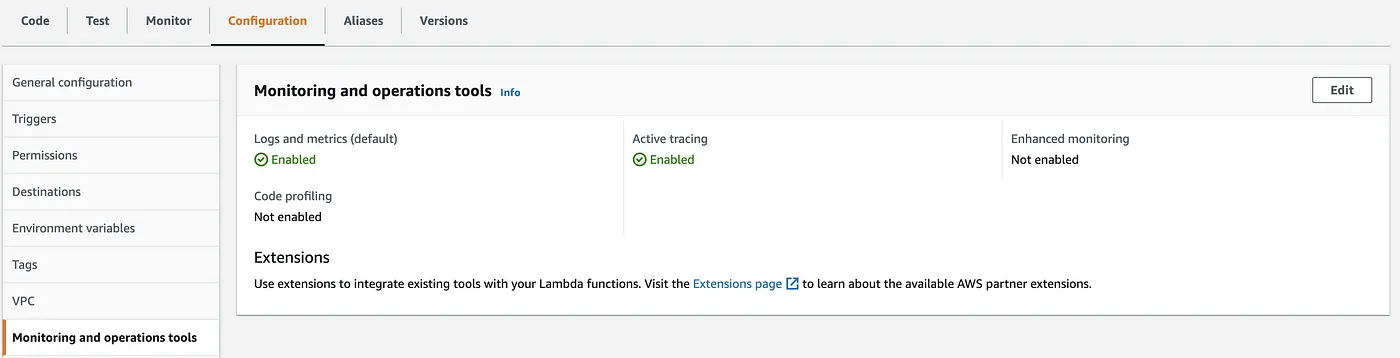
This can be achieved by navigating to the “Configuration” tab and in that tab navigating to “Monitoring and operations tools”. Then click Edit and toggle Active tracing. This shall now enable basic tracing in X-Ray.
C. Updates to the Lambda Code Base
1
2
3
4
5
import boto3
from aws_xray_sdk.core import xray_recorder
from aws_xray_sdk.core import patch_alllogger = logging.getLogger()
logger.setLevel(logging.INFO)
patch_all()
We will only need to add the above code in the top section of our handler file. This will patch the boto3 library with the aws_xray_sdk.core module.
Now we are all set to get the traces in X-Ray if our permissions are in place.
D. Let’s Navigate through X-Ray Console
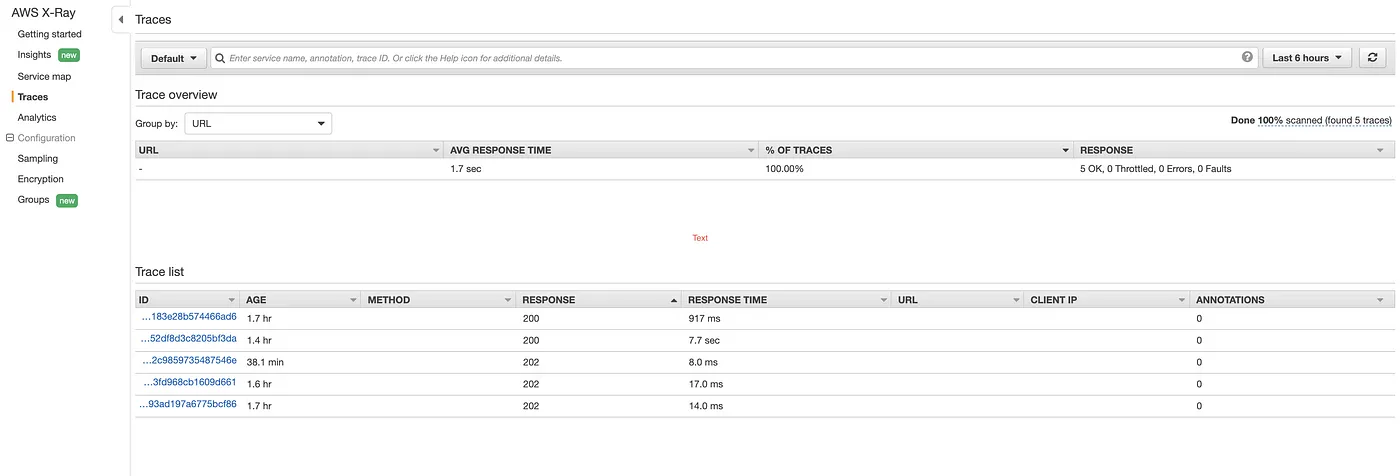
If we navigate to X-Ray and from side-bar click, on Traces we will something like above. We can select any of the trace ID this ID is also printed at the end of execution in the CloudWatch Log.
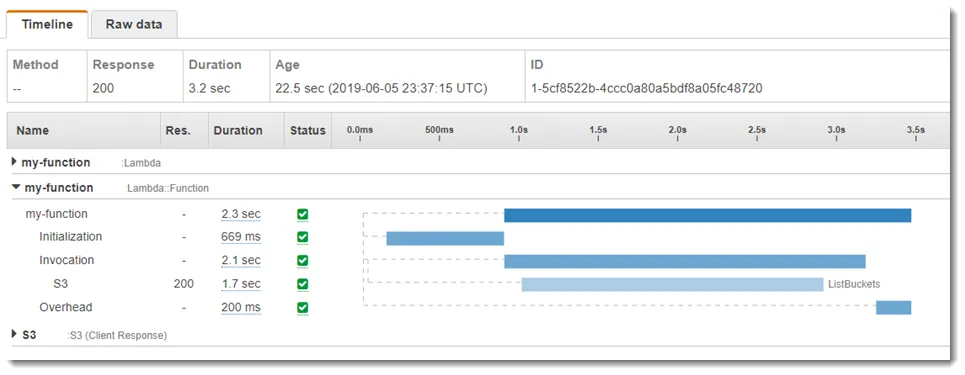
And inside these traces, we can see the detailed trace of execution and pressure points.
That’s all for now I hope this helps the greater audience.